Token Transactions
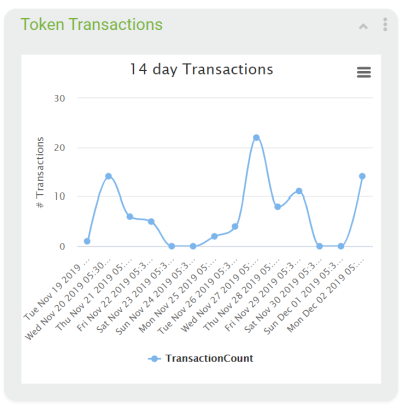
The Token transactions shows the transactions for a 2 week period. It is a chart plotted for the transaction dates versus the count of transactions.
If you click the  button, a dropdown list will be displayed as follows
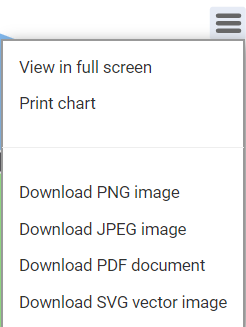
The user can choose from the options.
View full screen- will display the chart full screen
Print Chart- will print the activity channels chart
Download PNG image- will download the chart in PNG format
Download JPEG image- will download the chart in JPEG format
Download PDF document- will download the chart as a PDF document
Download SVG vector image- will download the chart as a SVG vector image
Clicking on the  icon will display a menu as shown below
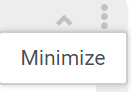
Minimize- will minimize the gadget