Contacts Map Chart
This chart shows how the contacts in the system are distributed geographically.
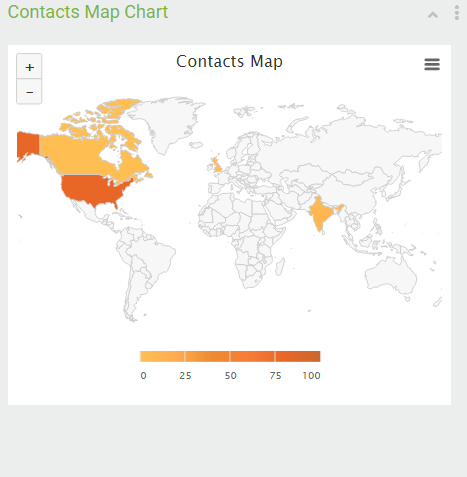
If you roll over the mouse pointer over the colored region, the no of contacts in that region is visible.
You can use the  buttons to zoom in or zoom out of the map.
If you click the  icon, the the following options are visible.
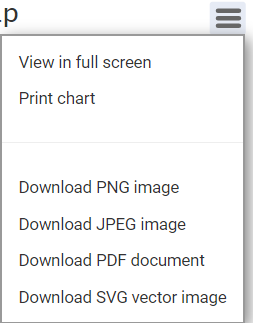
You can download the image in different formats, print the image and view it in full screen.
View Full screen- will open the chart in full screen mode
Print Chart- will print the chart
Download PNG Image- will downlaod the chart as a PNG image
Download JPEG image-will downlaod the chart as a JPEG image
Download PDF document- will downlaod the chart as a PDF document
Download SVG vector image- will downlaod the chart as a SVG vector image
Clicking on the  icon will display a menu as shown below
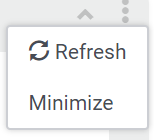
Refresh- will refresh the gadget
Minimize- will minimize the gadget