Charts
What are Charts?
BCERTin features Charts which gives you a graphical representation of a set of data. Think of Charts being pictorial representation of some information. They can be represented in any graphical format like Bar, Horizontal, etc.
Charts
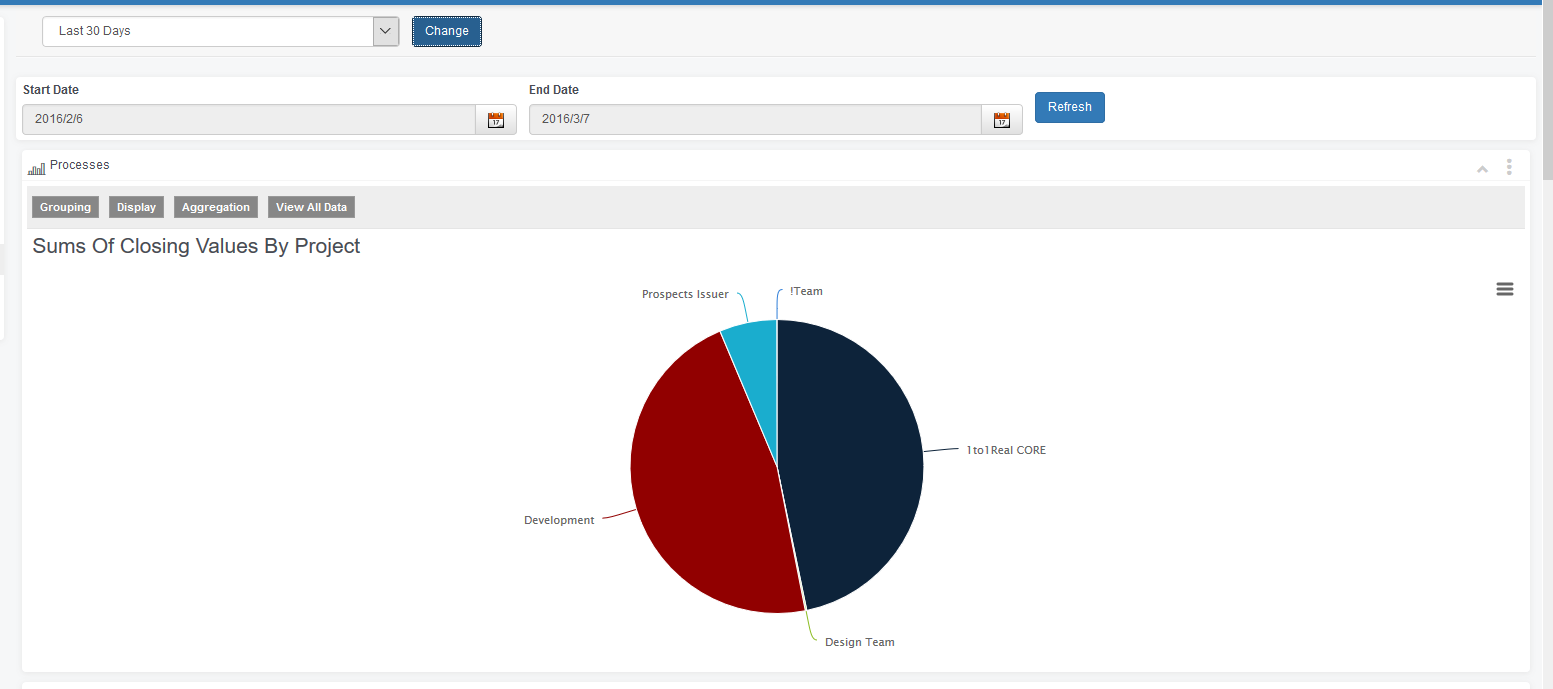
Here one of the charts that we use are called Pie Charts. In this chart page you will be able to see Contacts by Project,Contacts by Source Category, Contacts by Process Type,Contacts By Rep,Calendar Activity,Securities and Trade Confirmation data displayed in graphical form.

You have the option of changing the period of the data being displayed. For example in the screen shot below notice that the “Contacts by Projects” data is displayed in Bar chart for Last Year.
Now say, you want to display the data for Last 30 days. You will see that you need to change the period and click  . This will display another set of fields as shown below
You can change the Start Date and End Date and click  . Then the data displayed is as follows

Scroll down the page if you want to display Contacts by Source Category.

Scroll down the page if you want to display Contacts by Source Category.

To display Contact by Process Type, scroll down the page further

To display Contacts by Rep scroll further down as shown below

Calendar Activity
The Calendar Activity gadget gives a pictorial representation of Meetings & Activities, so you can know how many tasks, meetings and activities are to be completed in a day

Similarly you can view the data from Securities and Trade Commissions gadgets in a graphical format
Some Additional Features in Charts
- More Options
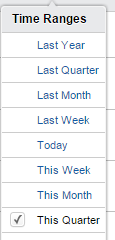
More Options allows you to choose a Time Range individually for each gadget. For example if you want to display only the data under Contacts gadget for the Last Month then you have to click  which will display the following

And when you click Display Options a drop down menu is displayed

You choose a Time Range from this, and the data below Contacts gadget will be displayed as per the criteria selected
2. Other Features within each gadget
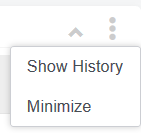
When  is selected from the right hand corner of Processes, a drop down menu as shown below is displayed which has the following options

Show History – This option will display any data that has been restricted below Restricted To
Minimize – Hide/Unhide the graphical display
How to Print a Chart
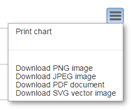
The Print feature has been provided for each Chart individually which allows you to download the chart in a particular format and then print it
